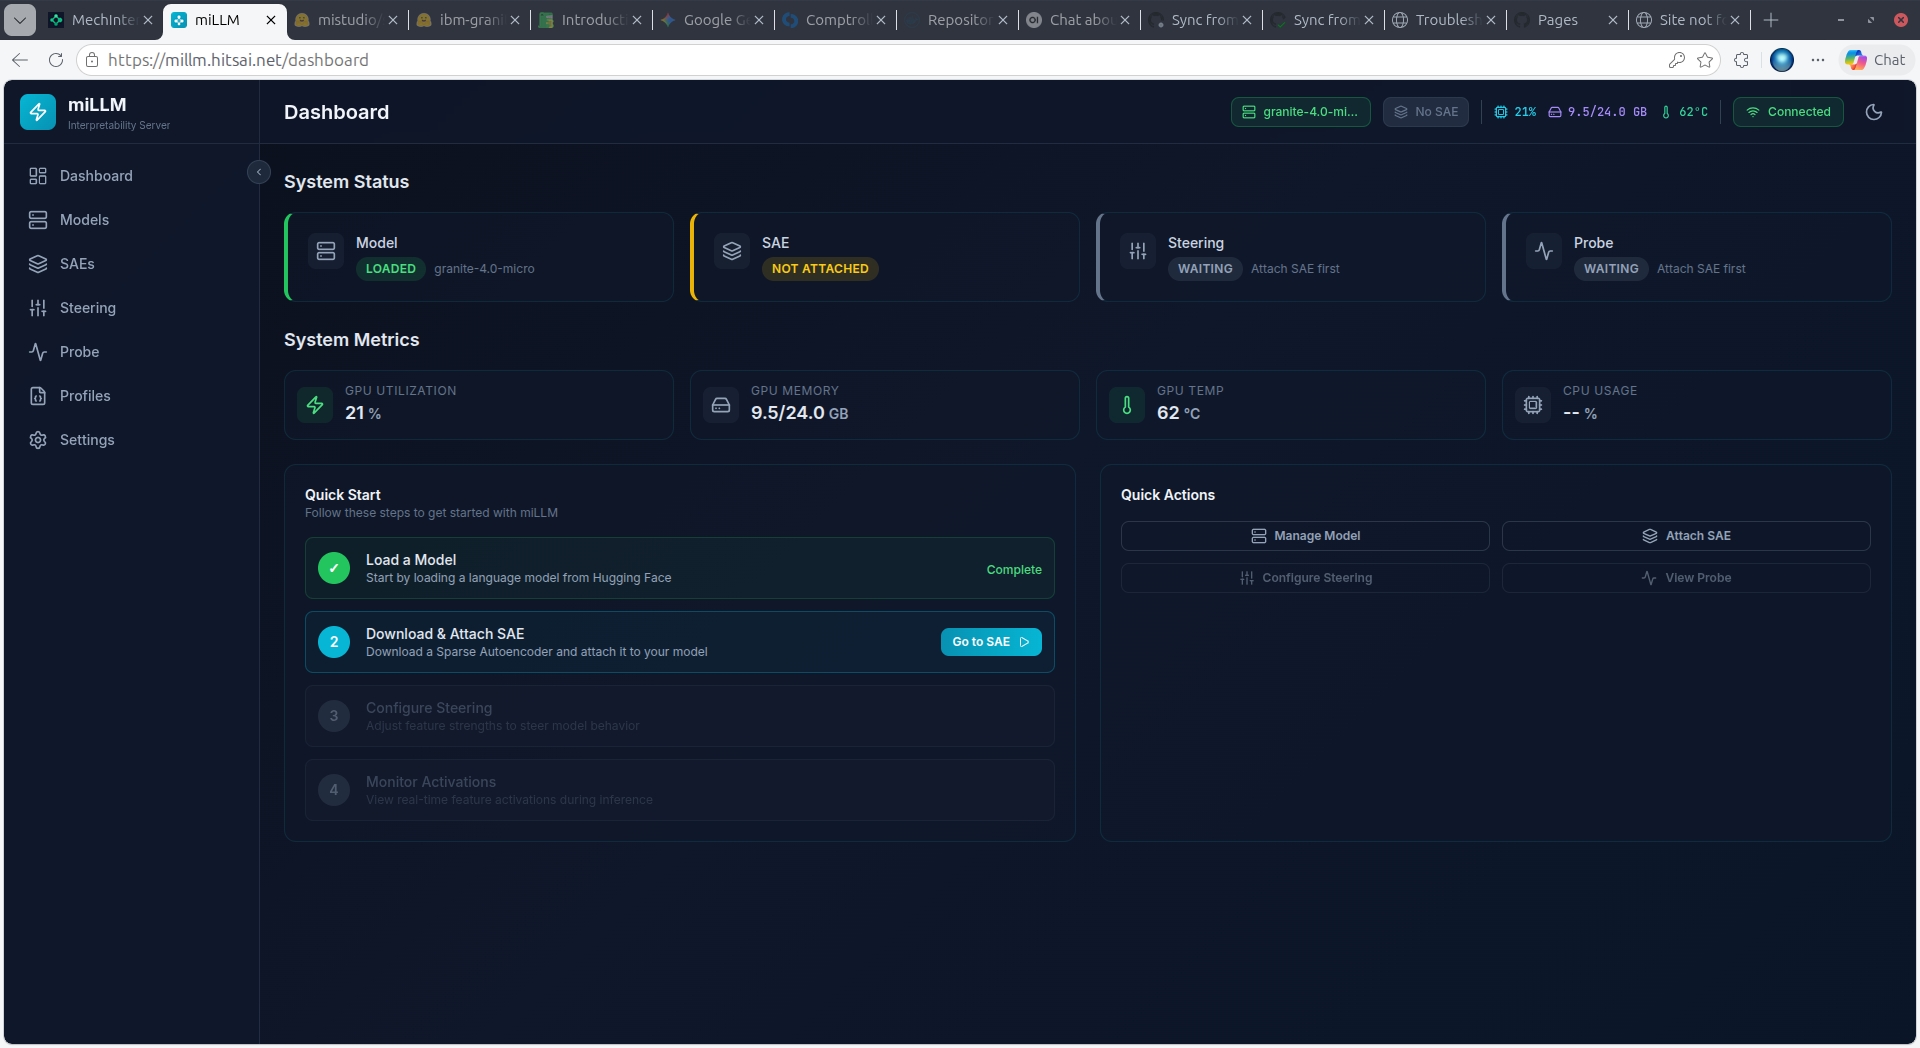
Dashboard & Navigation
Sidebar Navigation
The collapsible sidebar provides access to all pages. A persistent status bar at the top right shows the loaded model, SAE status, GPU metrics, and WebSocket connection state.
| Page | Purpose |
|---|---|
| Dashboard | System overview, GPU metrics, quick start guide |
| Models | Download, load, unload, and manage LLMs |
| SAEs | Download, attach, and manage Sparse Autoencoders |
| Steering | Configure feature steering values |
| Probe | Real-time activation monitoring |
| Profiles | Save/load steering configurations |
| Settings | Theme, connection status, server info |
Dashboard Overview
System Status
Four status cards show the current state at a glance:
| Card | States |
|---|---|
| Model | LOADED (green, shows model name) or No Model warning |
| SAE | ATTACHED (green, shows layer) or NOT ATTACHED (yellow) |
| Steering | ACTIVE with feature count, or WAITING (attach SAE first) |
| Probe | LIVE when monitoring, or WAITING (attach SAE first) |
System Metrics
Four real-time GPU metric cards below the status:
| Metric | Format | Notes |
|---|---|---|
| GPU Utilization | Percentage (e.g., 24%) | 100% = fully utilized |
| GPU Memory | Used/Total GB (e.g., 9.5/24.0 GB) | Watch for >90% before starting jobs |
| GPU Temperature | Degrees C (e.g., 64°C) | Green <70°C, Yellow 70–85°C, Red ≥85°C |
| CPU Usage | Percentage | System CPU load |
Quick Start Guide
The dashboard includes a step-by-step Quick Start checklist:
- Load a Model — Download and load from HuggingFace (green checkmark when complete)
- Download & Attach SAE — Get an SAE and hook it to a model layer
- Configure Steering — Add features and set strength values
- Monitor Activations — Watch which features fire during inference
Steps unlock progressively — each step links directly to the relevant page.
Quick Actions
Four shortcut buttons provide direct access to:
- Manage Model → Models page
- Attach SAE → SAEs page
- Configure Steering → Steering page
- View Probe → Probe page
Top Status Bar
The persistent bar across the top right of every page shows:
- Model name (teal badge) or nothing if unloaded
- SAE status —
No SAEbadge if not attached - GPU metrics — utilization %, memory, temperature (compact)
- Connection —
Connected(green) orDisconnected(red)
Settings Page
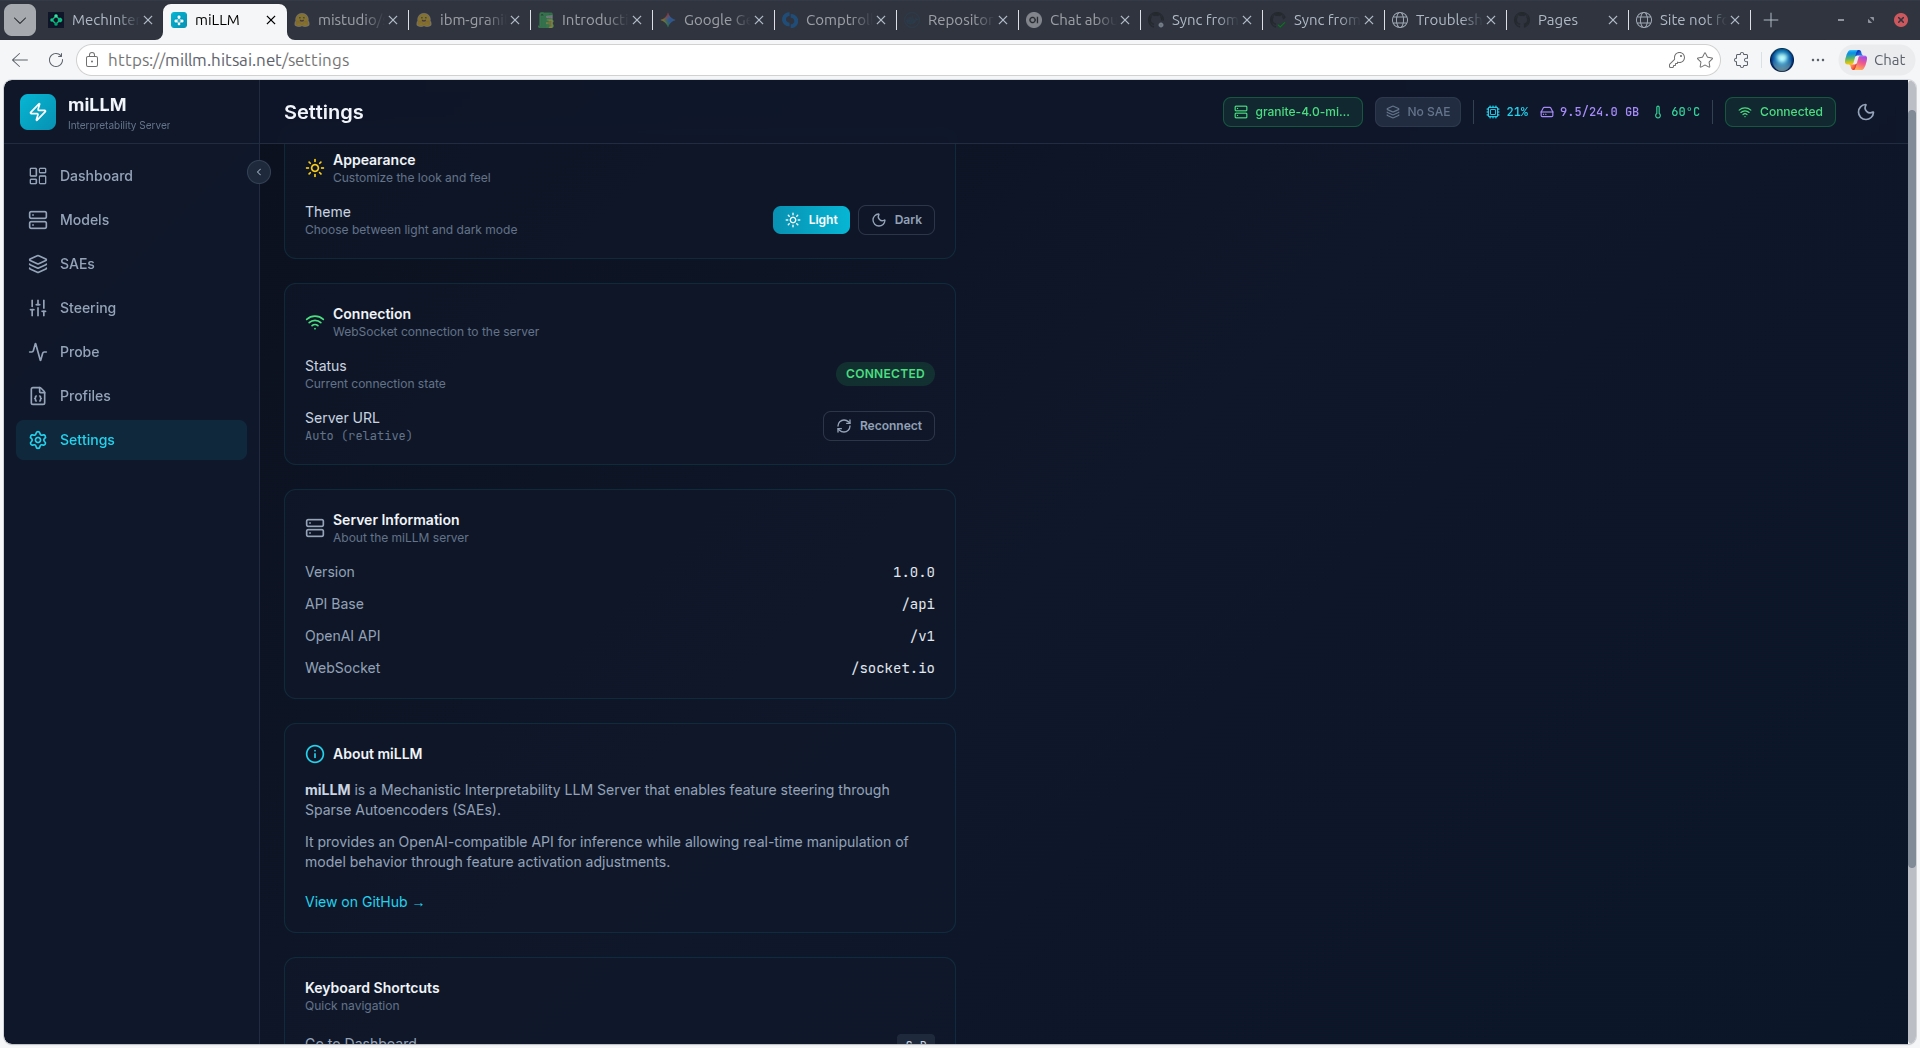
The Settings page provides:
- Theme toggle — Switch between light and dark mode
- Connection status — WebSocket state and reconnect button
- Server information — API version, base paths, WebSocket endpoint
- Keyboard shortcuts reference
Keyboard Shortcuts
G + D— Go to DashboardG + M— Go to ModelsG + S— Go to SAEG + T— Go to SteeringCtrl+Shift+T— Toggle theme